
Census Bureau Tools Can Show Homebuyers Areas Where They May Want to Live
Are you a new parent ready to buy your first home? Or a retiree seeking to downsize and purchase a place in a quiet community out of state?
Potential homebuyers may have some nonnegotiable criteria in mind like well-funded schools and access to quality health care, public transportation, libraries and shops.
How do they decide where to even start looking?
The U.S. Census Bureau’s suite of data and analytical tools can help.
Take its Public Sector statistics, for example, which provide comprehensive data on the finances, employment and structure of governments, including annual revenue, expenditures, debt and assets. They detail the scale of public employment, payrolls, tax collections, and specialized data on public pension systems and school districts.
When you’re in the market for a neighborhood with well-funded schools, you can use these stats to find out local revenue (versus state and federal funding) per pupil, indicating a community’s capacity to support its schools.
Other Census Bureau homebuyer resources:
- The Building Permit Survey, which shows housing supply trends.
- Survey of Construction, which provides characteristics and sales of single and multifamily housing units.
Census data tools, like Census Business Builder (CBB) and Job-to-Job (J2J) Flows Explorer can help you visualize this information by providing key data about the landscape in a user-friendly format.
How to Use the Census Business Builder
Take a retired couple carefully planning the purchase of their “forever home.”
They start their search with a must-have list:
- Suburban setting.
- Near a major city.
- Close to restaurants, sports and entertainment.
- Access to quality health care.
The CBB tool enables them to explore demographic, economic and social characteristics like median household income, population, types of retail establishments and a demographic profile of the local workforce. Figure 1 displays the tool’s landing page, where users can access the dashboard and customize or filter the data.
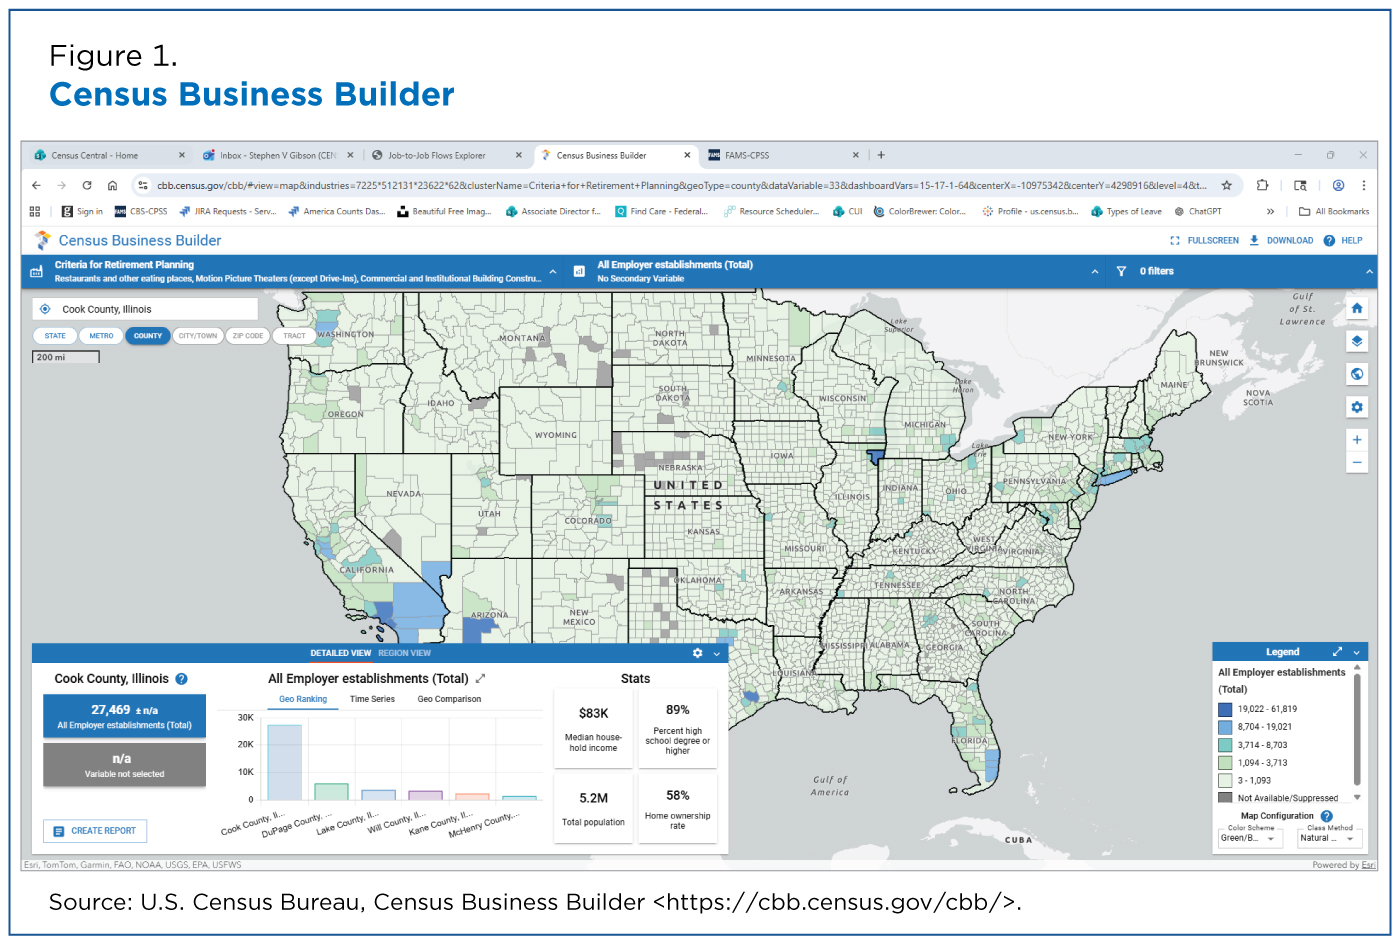
The map feature enables users to zoom in for more detailed, lower-level geographic views or zoom out for a broader perspective.
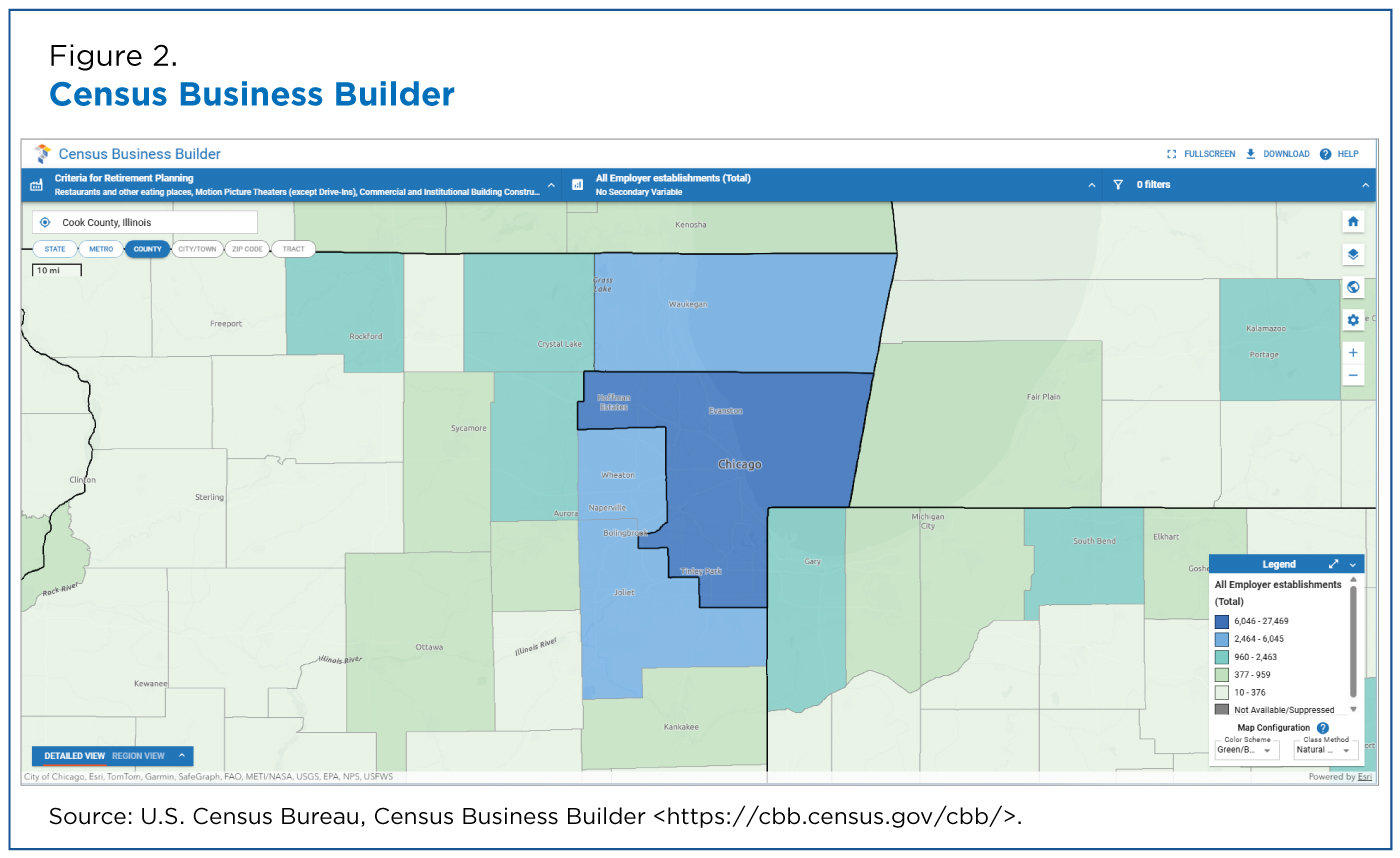
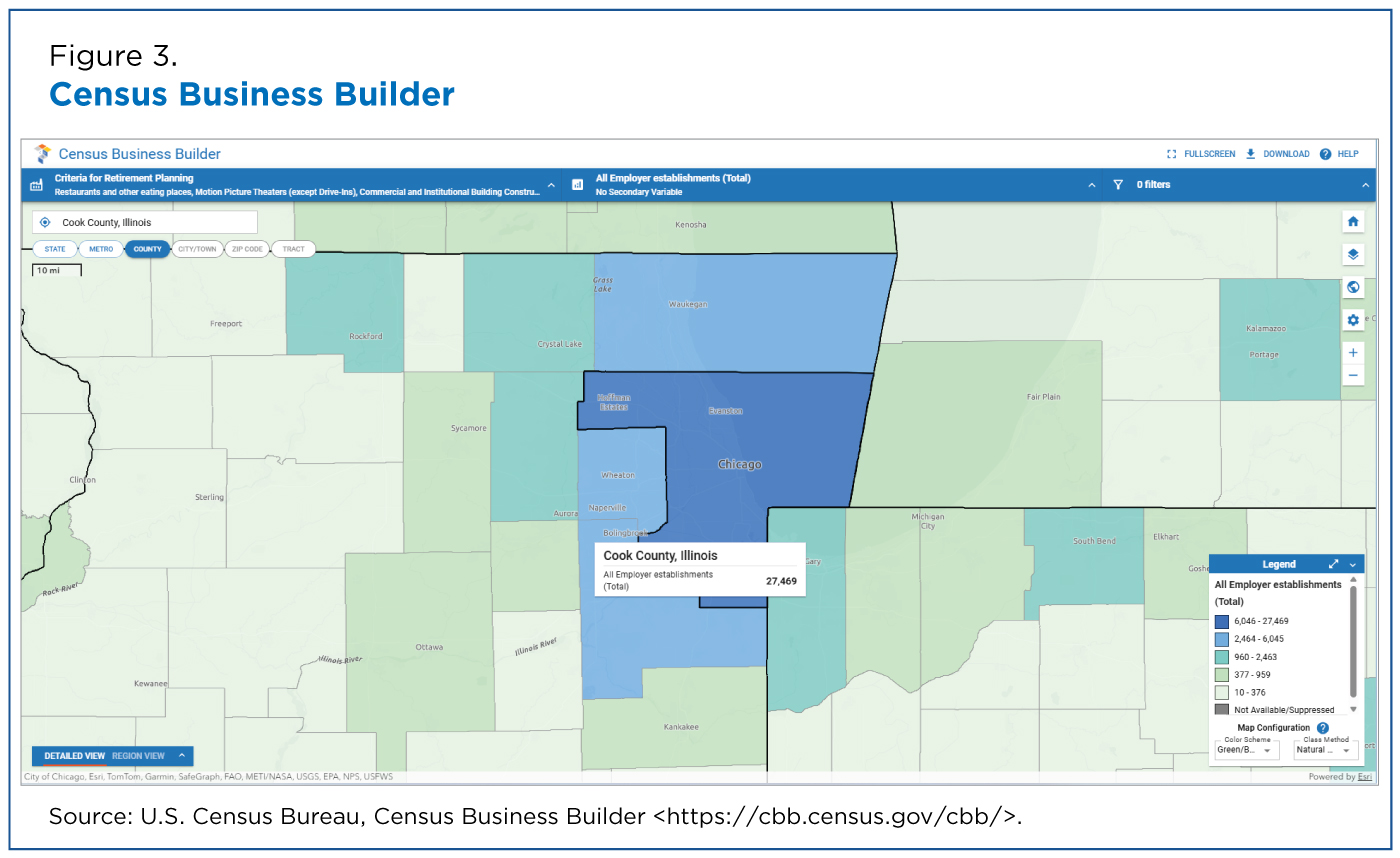
When the map zooms into a county level, high-level data becomes visible to the user.
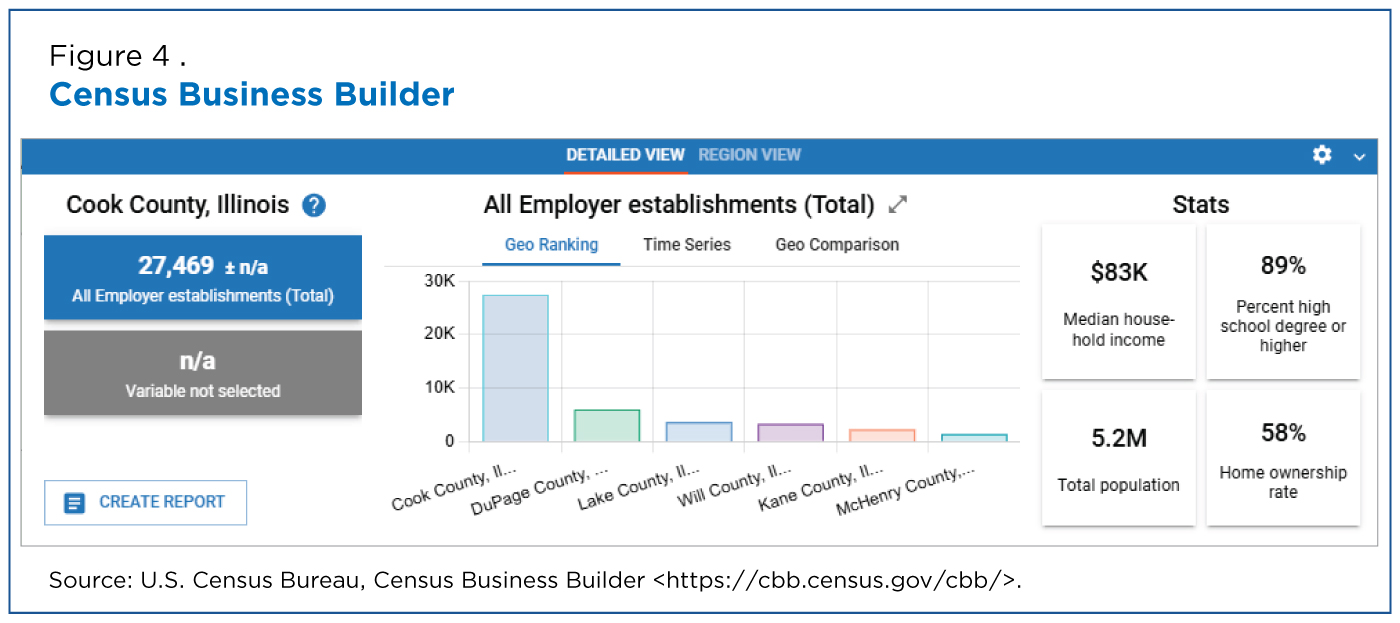
The CBB generates a dashboard for the maps above that includes features such as geographic ranking, geographic comparison and time series. Statistics are customizable by business, demographic and socioeconomic characteristics.
The tool can also create a report that enables these retirees to decide if a place is right for them.
Job-to-Job Flows
While some buyers choose a location based on commuting convenience or proximity to jobs, others may be focusing on the best place to retire.
The Census Bureau’s J2J Flows Explorer, often used by workforce planners and economic developers, can help homebuyers at any age or stage.
For example, individuals planning for retirement can use it to identify areas with strong or growing employment in sectors that support quality of life, such as health care, retail and service industries.
By examining employment trends by industry (i.e., Health Care and Social Assistance, Retail Trade, and Accommodation and Food Services) and geography, users can gain insight into locations that may offer the amenities and services key to retirement planning.
Those age 55 and over, still working but considering relocating, can also use the tool to explore broader employment patterns and economic activity to help them decide where they may want to move next.
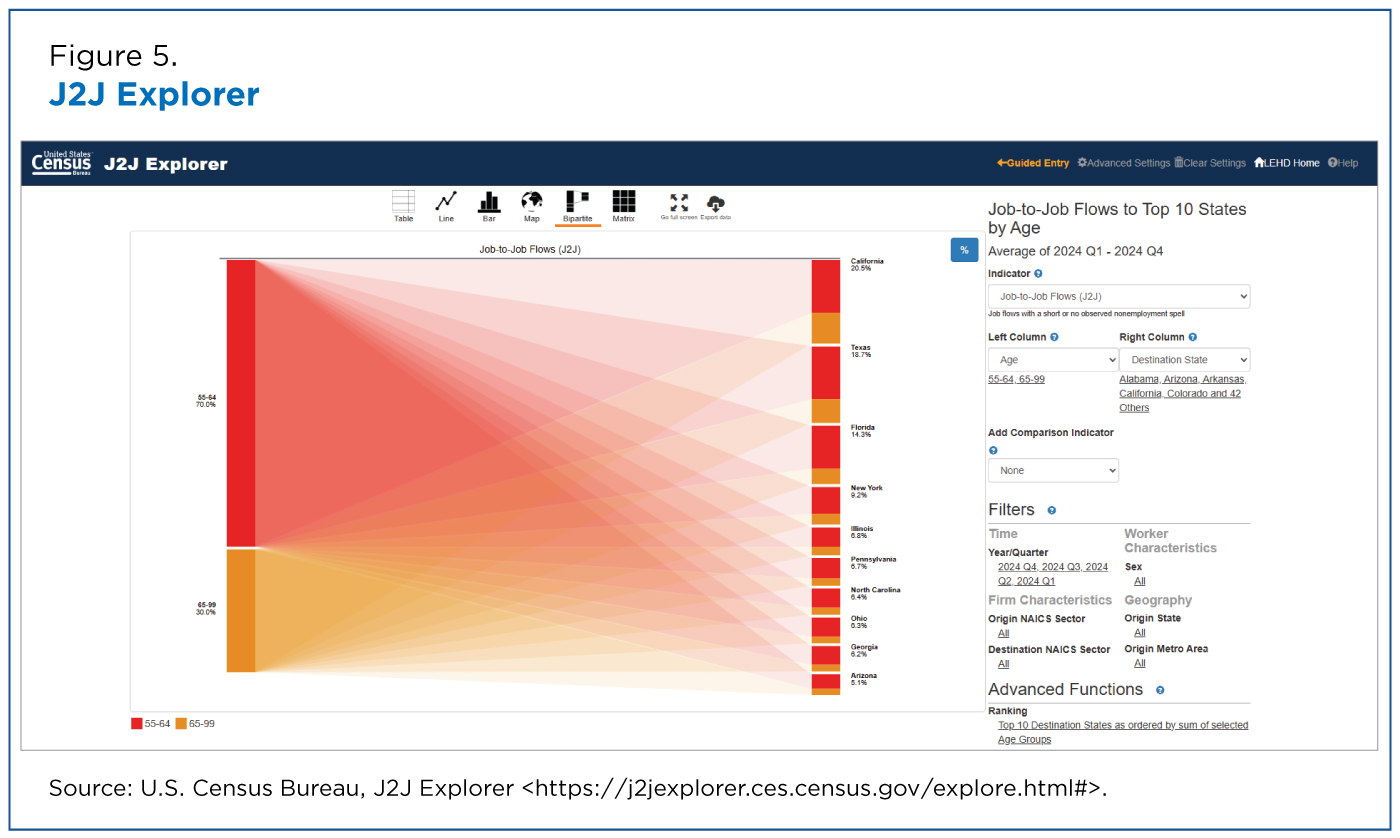
Using the J2J Explorer, the top destination states for people 55 and older in 2024 were, not surprisingly, the country’s most populous ones: California, Texas, Florida and New York (Figure 5).
They were followed by other high-population states like Illinois, Pennsylvania, North Carolina, Ohio, Georgia and Arizona.
Additional Resources and Data
The following webinar, “Exploring Census Data: Using Census Data to Buy a House,” walks you through ways to apply census data from the American Community Survey, American Housing Survey and Rental Housing Finance Survey in your home search.
To gauge future building and construction activity in a given area, explore Building Permit Survey and the Survey of Construction data.
Related Statistics
Subscribe
Our email newsletter is sent out on the day we publish a story. Get an alert directly in your inbox to read, share and blog about our newest stories.
Contact our Public Information Office for media inquiries or interviews.
Related America Counts Stories
-
HousingHow the Nation’s Housing Changed in 20 YearsSeptember 16, 2025Twenty years of American Community Survey data show higher housing costs for renters and a smaller share of homeowners with mortgages.
-
HousingShare of Owner-Occupied, Mortgage-Free Homes Up in 2024January 29, 2026The share of U.S. homeowners without a mortgage was higher in 2024 than a decade earlier nationwide and in every state, though not all counties saw increases.
-
HousingWhere You Can Get More House for the MoneyJune 28, 2024Census Bureau construction data show the cost and characteristics of the nation’s new homes by region.
-
Business and EconomyNew Ways to Access One-of-a-Kind DataAugust 06, 2026The Annual Integrated Economic Survey expands how users can access economic data by industry and geography.
-
PopulationMeasuring Foreign-Born Population Over Nation’s 250-Year HistoryJuly 21, 2026Historical census data document changes in the foreign-born population in both numbers and countries of origin.
-
Business and EconomyA Road Trip Across the Vacation EconomyJuly 14, 2026The Census Bureau rings in the summer with a travel statistics road map.
-
HealthWhere You Live Matters for Your Health and So Does How We Measure ItJuly 09, 2026Census Bureau research helps policymakers and researchers identify the most reliable ways to predict health outcomes and distribute resources accordingly.